

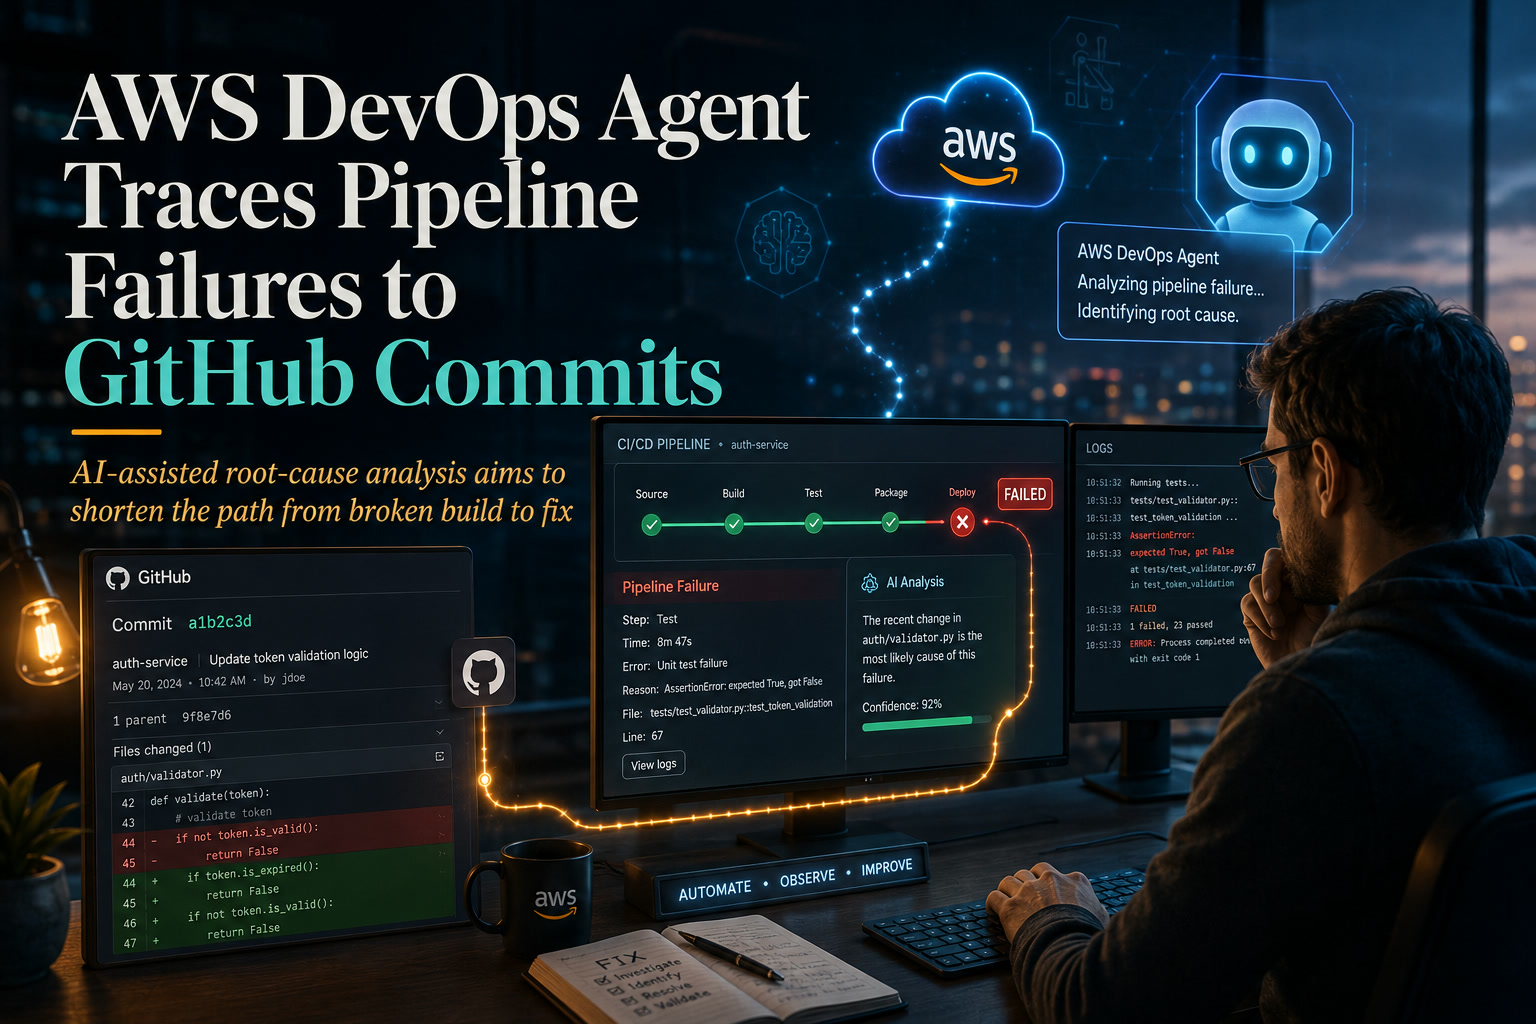
When a CI/CD pipeline breaks, the actual error is often only the beginning of the investigation. Engineers may need to jump between GitHub commits, pull requests, CodeBuild logs, deployment records and CloudWatch metrics before they can work out what actually caused the failure.
AWS wants to reduce that manual detective work with its AWS DevOps Agent, which can automatically investigate pipeline failures and connect them to recent GitHub code changes.
In a newly published walkthrough, AWS demonstrates how DevOps Agent can work alongside AWS CodePipeline, Amazon CloudWatch, AWS Lambda and GitHub to move from a failed build to a probable root cause much faster.
The idea is not necessarily to let AI fix production systems automatically. Instead, the agent performs the first round of investigation, collects relevant evidence and presents engineers with a structured hypothesis about what went wrong.
Why Pipeline Failure Investigation Takes So Much Time
Modern CI/CD pipelines can involve multiple stages, services and monitoring systems.
A developer may push a change to GitHub, CodePipeline triggers a build, CodeBuild runs tests, deployment begins and downstream services start reporting health metrics.
When something breaks, engineers often need to manually answer several questions.
What changed recently?
Which commit introduced the problem?
Did the build fail because of code, configuration or dependencies?
Did the deployment succeed but the application fail afterwards?
Which logs actually contain the useful error?
Each system holds only part of the story.
AWS DevOps Agent is designed to correlate those pieces automatically.
How AWS Connects CloudWatch to the DevOps Agent
AWS' example begins with application source code stored in GitHub and a CodePipeline workflow handling the build, testing and deployment stages.
Amazon CloudWatch monitors logs and pipeline metrics throughout the process.
If CloudWatch detects something unusual, such as a failed build, deployment rollback or application health threshold being exceeded, the relevant alarm changes into an ALARM state.
That state change then triggers an AWS Lambda function referred to in the walkthrough as the WebHook Executor.
The Lambda function takes the CloudWatch alarm information, extracts the relevant context and sends an authenticated request to AWS DevOps Agent.
From there, the agent begins its investigation.
It can examine the failure alongside information from the connected GitHub repository, including recent commits and pull-request activity, to determine whether a particular code or configuration change is associated with the incident.
The Agent Builds a Root-Cause Hypothesis
The useful part is not simply identifying that the pipeline failed.
CloudWatch and CodePipeline already know that.
DevOps Agent attempts to answer the more important question:
Why did it fail?
AWS positions the system as part of its Operational Excellence approach under the Well-Architected Framework.
The agent is intended to assist with detection, diagnosis and mitigation planning while also keeping a record of what it examined and how it reached its conclusions.
That audit trail is particularly important for QA, DevOps and production teams.
If an AI system recommends a rollback or identifies a particular commit as responsible, engineers need to see the evidence before acting on that recommendation.
GitHub Access Has to Be Carefully Configured
Setting up the integration requires permissions on both the AWS and GitHub sides.
Organisations need AWS Identity and Access Management roles for the DevOps Agent environment, referred to as an Agent Space.
Additional roles may also be required if the organisation wants the agent to monitor resources across multiple AWS accounts.
On GitHub, administrators must decide which repositories the DevOps Agent is allowed to access.
AWS' walkthrough has administrators create an Agent Space for the application, generate the necessary IAM roles and configure a webhook.
The webhook credentials are stored in AWS Secrets Manager, while GitHub repositories are connected through the Agent Space's Capabilities section.
Once configured correctly, the repository connection changes to a connected state and becomes available to the agent during investigations.
CloudWatch monitoring must already be in place, otherwise there is no useful alarm signal to start the process.
AWS Demonstrates the System With Two Broken Deployments
AWS uses two deliberately introduced faults to demonstrate how the investigation works.
The first involves a configuration mismatch.
An engineer changes the application's DYNAMODB_TABLE_NAME environment variable to reference HotelRooms, but the corresponding CloudFormation configuration is not updated.
The application therefore expects a DynamoDB resource that does not match the deployed infrastructure.
The mismatch causes testing and application errors.
CloudWatch detects the resulting failures and DevOps Agent investigates the incident.
The agent correlates the errors with the configuration change and creates a timeline showing when the setting was changed, when the service was redeployed and when connection failures began.
Instead of an engineer manually comparing deployment timestamps against configuration changes, the agent performs that initial correlation automatically.
A Misspelled Dependency Shows Another Common Failure
The second example is even more familiar to developers.
An engineer changes the Node.js dependency express to the misspelled expresss inside package.json.
The change is committed to the main branch.
CodePipeline sees the new commit and begins another pipeline execution.
During the CI stage, npm install fails because the misspelled package does not exist.
An Amazon EventBridge rule detects the failed stage and triggers the Lambda webhook, which starts another DevOps Agent investigation.
The agent examines the relevant CodeBuild output, sees the dependency installation error and then connects that failure to the recent GitHub commit.
The result is a direct link between the broken pipeline and the code change responsible for it.
For developers and QA teams, that is potentially where much of the time saving comes from.
Finding an error in the logs is usually straightforward.
Working out which recent change caused it can take considerably longer.
This Could Reduce the First Stage of Incident Triage
The examples demonstrate a practical use of AI that does not require giving an agent complete control of production infrastructure.
Instead, the agent takes over a repetitive investigation process.
It reads monitoring information.
It checks build logs.
It looks at recent commits.
It creates a timeline.
It proposes a likely root cause.
An engineer can then review the findings before deciding what to do next.
For teams managing frequent releases, that could reduce the amount of time spent on routine failure triage.
If a simple configuration error or dependency typo can be identified automatically within minutes, engineers can spend more time resolving the issue rather than gathering evidence.
AWS Is Not Letting the Agent Automatically Fix Production
An important limitation is that AWS' walkthrough stops at diagnosis and remediation guidance.
The DevOps Agent is not shown automatically changing source code, reverting commits or deploying fixes into production.
AWS also stresses the importance of human oversight for production environments.
That is probably the sensible boundary for now.
An agent may correctly determine that a particular commit is strongly associated with an incident, but automatically reverting it could introduce another problem if the system does not understand the full production context.
Providing engineers with a well-supported recommendation is much lower risk than allowing the AI to execute every remediation independently.
The Demonstrations Are Still Relatively Simple
There is another limitation worth keeping in mind.
Both examples demonstrated by AWS are intentionally straightforward.
One involves an incorrect environment variable.
The other involves a misspelled package name.
In both situations, there is a fairly direct connection between one recent change and one obvious failure.
Real production incidents are often considerably messier.
A failure may involve several microservices, multiple deployments, infrastructure changes, third-party APIs and problems that only occur under specific traffic conditions.
The most important unanswered question is therefore how reliably DevOps Agent can identify root causes when the problem involves several interacting changes rather than one obvious mistake.
AWS' walkthrough does not provide large-scale production performance figures or comparison data showing how often the agent's diagnosis is correct.
There Are Additional AWS Costs to Consider
The DevOps Agent itself uses a pay-per-use pricing model, but it is only one component of the overall architecture.
Organisations may also incur costs from:
For large engineering teams, the value calculation will depend on whether faster incident investigation saves enough engineering time to justify those additional costs.
That could be particularly attractive for organisations running many pipelines where failures happen frequently.
AI Is Moving Deeper Into DevOps Workflows
The bigger story is how AI is gradually moving from coding assistance into operational engineering.
AI coding assistants already help developers generate functions, explain code and review changes.
DevOps agents extend that capability into the period after code has been committed.
Instead of only helping write software, AI can now potentially watch deployments, investigate failures and correlate production problems with the exact changes that introduced them.
That creates a much more continuous AI-assisted development cycle:
Code is written.
AI helps review it.
CI/CD tests it.
Monitoring detects a problem.
Another AI agent investigates why it failed.
Humans still make the final production decision, but increasingly less time needs to be spent assembling the evidence manually.
Final Thoughts
AWS DevOps Agent offers an interesting approach to one of the more frustrating parts of CI/CD operations: determining exactly which change caused a pipeline to fail.
By connecting CloudWatch alarms, CodePipeline failures, CodeBuild logs and GitHub commit history, the agent can perform the initial investigation that engineers would normally handle manually.
AWS' demonstrations show the system successfully identifying both a configuration mismatch and a broken dependency introduced through a GitHub commit.
The technology looks particularly promising for routine failures where the cause is closely related to a recent change.
The bigger test will come with real-world incidents involving multiple services, overlapping deployments and less obvious root causes.
For now, the strongest use case may be as an AI-powered first responder for CI/CD failures—one that gathers the evidence, traces the timeline and gives engineers a credible place to start, while leaving the final remediation decision in human hands.










Comments 0