

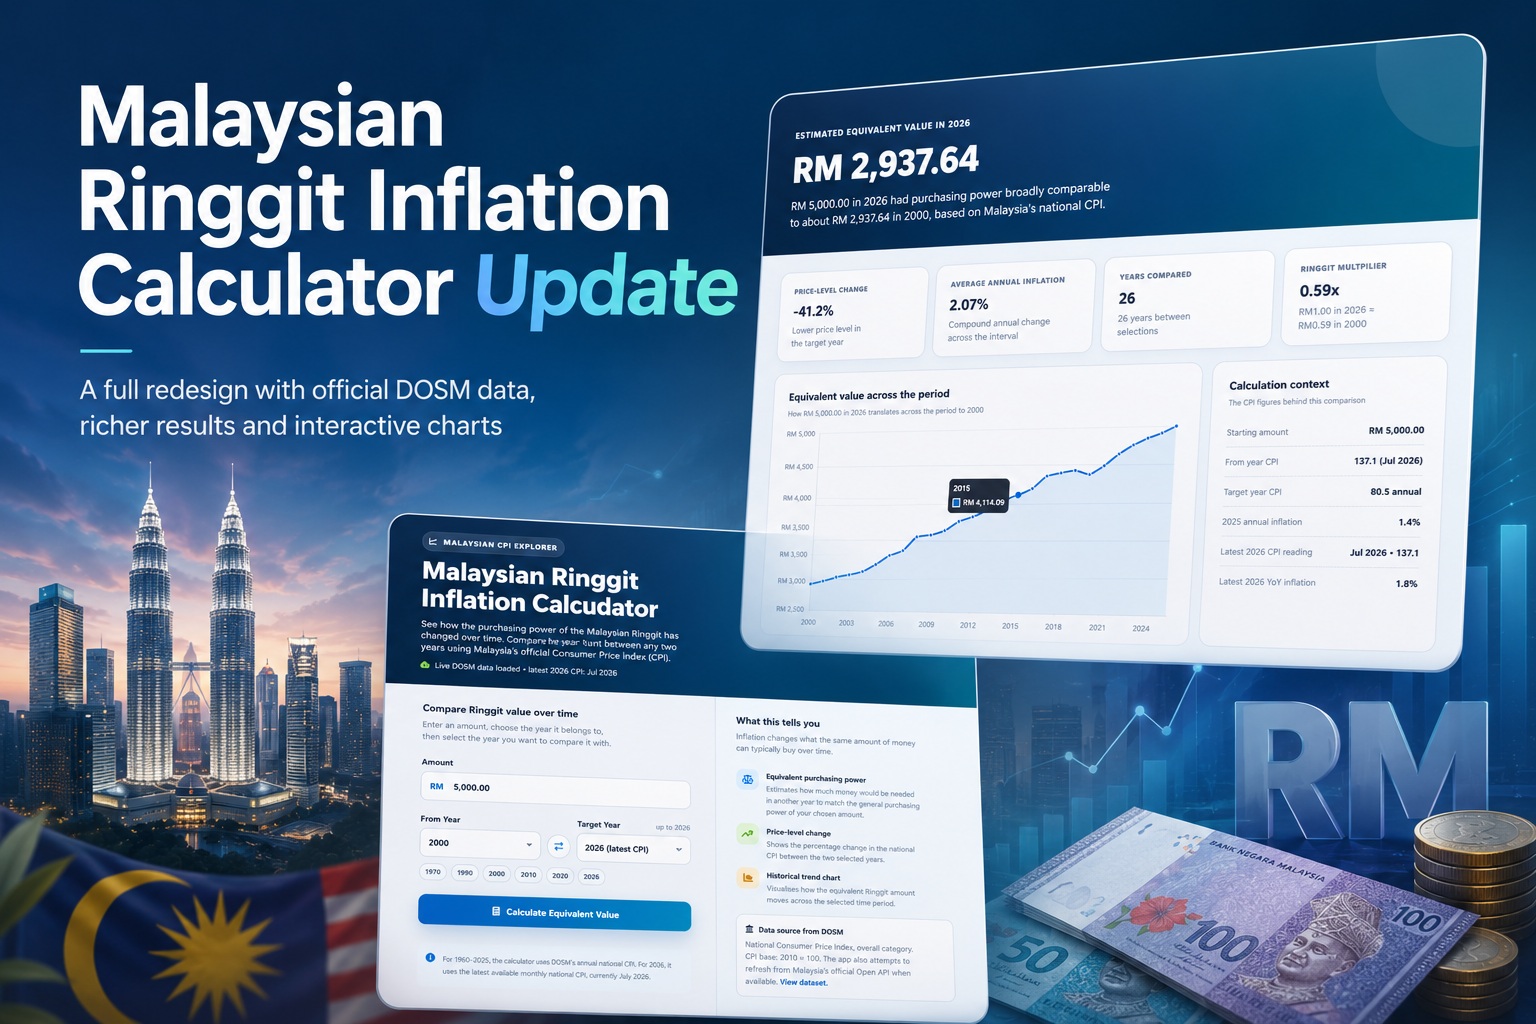
Inflation is something most Malaysians experience every day, even if we do not always notice it directly. A meal that once cost RM5 may now cost considerably more, household expenses gradually increase, salaries may not stretch as far as they used to, and the purchasing power of the Ringgit changes over time. To make these changes easier to understand, the Malaysian Ringgit Inflation Calculator on Lemon Web has received a major update with a completely redesigned interface, improved calculations, official inflation data from the Department of Statistics Malaysia (DOSM), richer explanations and interactive historical charts.
The updated application is no longer just a simple calculator that produces a single converted figure. It has been expanded into a more informative tool that helps users understand what inflation actually means, how Malaysia's Consumer Price Index has changed through the years, and how an amount of money from one period compares with another.
A Completely Redesigned Malaysian Ringgit Inflation Calculator
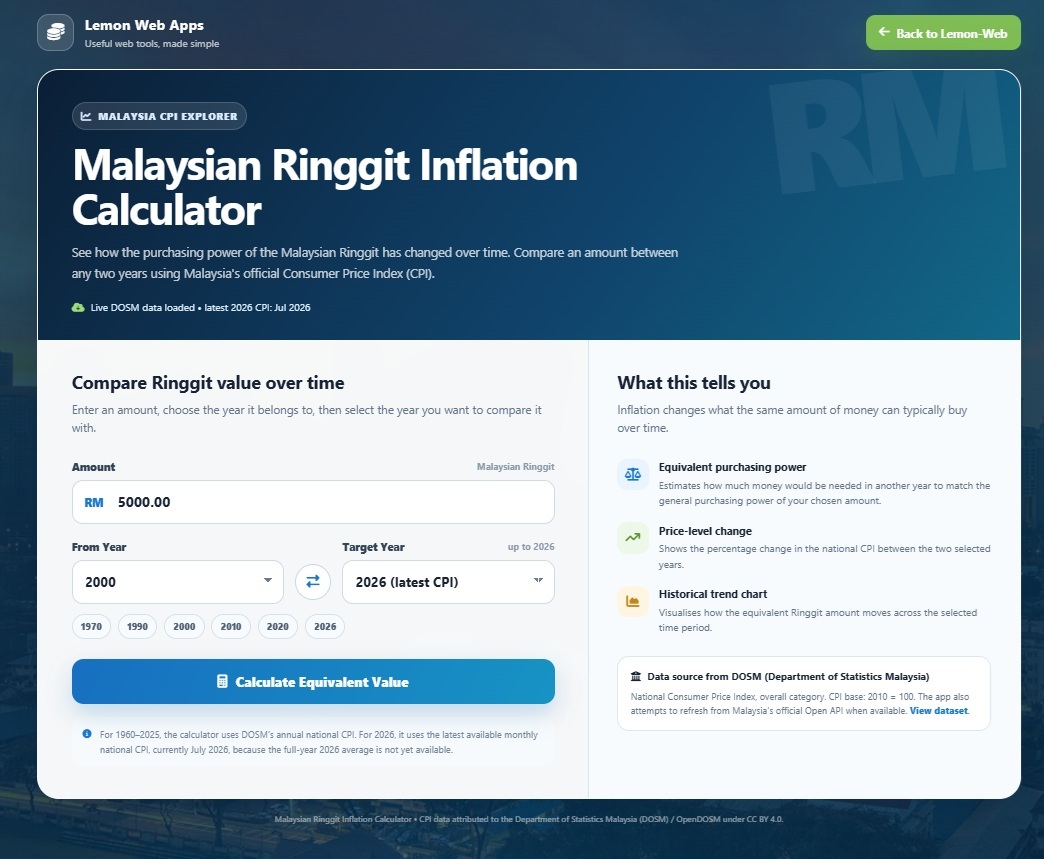
The first major change is immediately noticeable when opening the application. The interface has been completely redesigned to make the calculator cleaner, more modern and easier to use across desktops, tablets and mobile devices.
The application has also been renamed to Malaysian Ringgit Inflation Calculator, making its purpose much clearer from the moment users arrive on the page.
Instead of overwhelming users with complicated economic terminology, the redesigned interface focuses on a straightforward process. Users simply enter an amount in Malaysian Ringgit, select a starting year and choose the year they want to compare it against.
The calculator then handles the historical inflation calculation automatically.
This means someone could compare RM1,000 from 1990 with its approximate equivalent value in 2026, or compare the purchasing power of RM10,000 between 2000 and 2020.
The updated design also makes it easier to experiment with different dates and amounts without needing to understand how inflation calculations work behind the scenes.
Target Year Updated to 2026
One of the most important improvements in this release is the addition of 2026 as the latest target year.
Because 2026 is still an ongoing year, a complete annual inflation figure for the entire year is naturally not yet available. Instead of estimating or inventing a full-year figure, the calculator uses the latest available official CPI information for 2026 while clearly explaining this limitation to users.
This is an important distinction because inflation data should always be presented with context.
Historical years can use completed annual CPI figures, while the current year may only have monthly CPI readings available so far. The application now communicates this directly rather than presenting the numbers without explanation.
This approach helps make the calculator more transparent and prevents users from assuming that a partial-year figure represents the final inflation rate for 2026.
Inflation Data Now Comes from DOSM
Perhaps the most important improvement behind the scenes is the change in how inflation information is sourced.
The calculator now uses data from the Department of Statistics Malaysia (DOSM), Malaysia's official statistical authority.
DOSM publishes Consumer Price Index data that tracks changes in the prices of goods and services commonly purchased by Malaysian households. CPI is one of the most widely used indicators for measuring inflation.
By using DOSM information, the calculator can base its calculations on Malaysia-specific historical price movements rather than relying on generic global inflation estimates or manually assumed inflation percentages.
This makes the calculator significantly more relevant for Malaysians.
The updated application includes historical CPI information covering decades of Malaysia's economic history, allowing users to explore how purchasing power has changed over long periods.
Where supported, the application can also retrieve updated information from Malaysia's official data services, while retaining local historical data as a fallback so the calculator can continue functioning reliably.
Understanding CPI Instead of Just Inflation Percentages
One of the biggest changes to the calculation methodology is the use of actual CPI index values.
Many simple inflation calculators work by storing yearly inflation percentages and repeatedly compounding those percentages from one year to another.
While that approach can work, comparing CPI index values provides a very direct method of determining how overall price levels changed between two periods.
For example, if the CPI index in the target year is substantially higher than the CPI index in the starting year, the calculator can determine how much more money would theoretically be required to maintain similar purchasing power.
In simplified terms, the calculation compares:
Target Year CPI ÷ Starting Year CPI
The resulting ratio is then applied to the amount entered by the user.
This helps the calculator answer a familiar question:
"If I had RM1,000 in that year, roughly how much would I need today to have similar purchasing power?"
Of course, this does not mean every individual item has increased by exactly the same amount.
Property prices, restaurant meals, healthcare, electronics, fuel, education and many other categories can behave very differently from the overall CPI.
However, CPI provides a useful broad measurement of how consumer prices have changed across the economy.
A Much More Detailed Results Page
Previously, an inflation calculator could simply return something like:
"RM1,000 then is equivalent to RM1,600 today."
While useful, that number alone does not explain very much.
The new result page has therefore been completely redesigned to provide considerably more context.
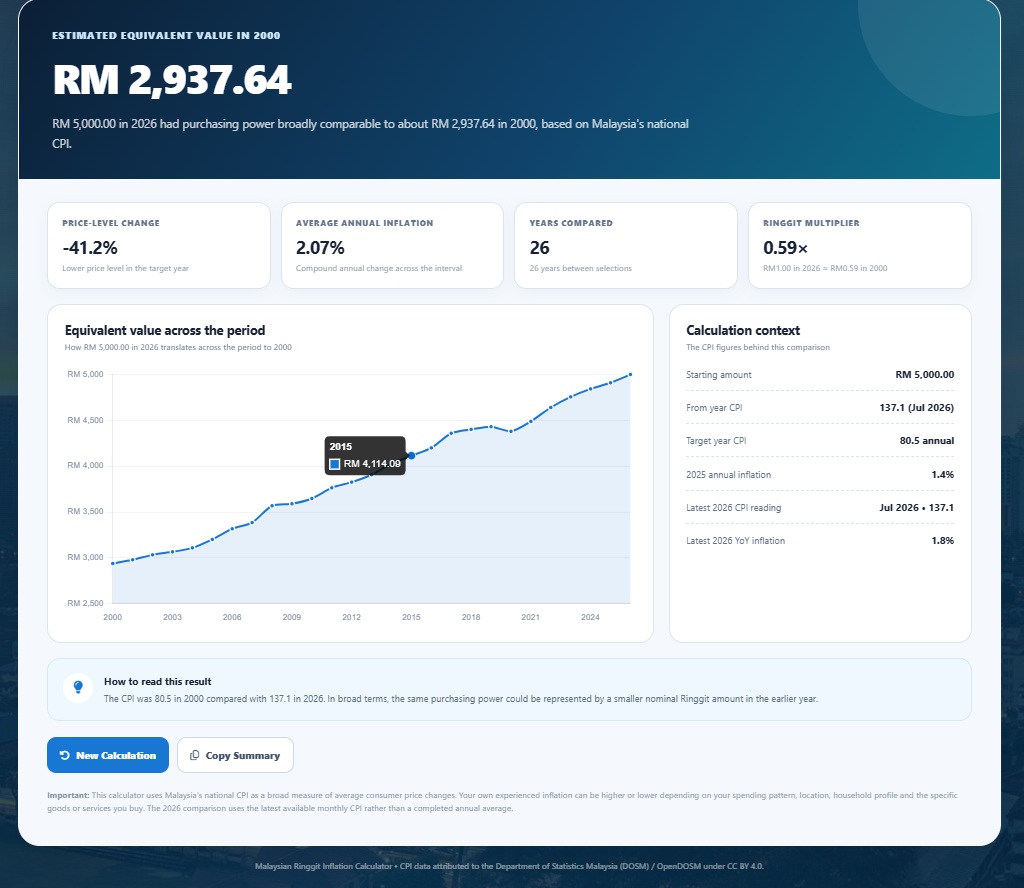
The equivalent Ringgit value remains the primary result, but users can now also see additional measurements explaining what happened between the selected years.
Depending on the calculation, the result can include the starting CPI, target CPI, total percentage change in price levels, the number of years being compared, the purchasing-power multiplier and the compound average annual inflation rate.
Instead of leaving users to interpret these numbers themselves, the application also provides a written explanation describing what the result means in practical terms.
This transforms the application from a basic numerical calculator into a small educational tool for understanding Malaysian inflation.
Interactive Charts Make Historical Changes Easier to See
Numbers are useful, but inflation is often easier to understand visually.
For this reason, the updated Malaysian Ringgit Inflation Calculator now includes charting within the result page.
After completing a calculation, users can see how the equivalent value of their selected amount changes across the historical period.
This is particularly useful when comparing dates that are several decades apart.
Instead of only seeing the starting point and final result, users can observe how purchasing power gradually changed over time.
For example, someone comparing RM1,000 between 1980 and 2026 can see that inflation did not occur as a single jump. Prices changed gradually across different economic cycles, periods of higher inflation and periods where price growth was relatively moderate.
This visual representation gives users a much better sense of how inflation accumulates.
Useful for Understanding Salaries and Purchasing Power
One particularly interesting way to use the calculator is to compare historical salaries.
Imagine someone earned RM2,000 per month many years ago.
Simply comparing RM2,000 then with RM2,000 today does not provide a meaningful comparison because the purchasing power of those two salaries can be very different.
By entering the historical salary into the Malaysian Ringgit Inflation Calculator, users can estimate what that amount would represent in today's money.
This can provide useful context when discussing older salary scales, historical job advertisements or changes in household income.
It can also help explain why older monetary figures sometimes appear surprisingly small by modern standards.
A RM10,000 salary several decades ago could represent dramatically greater purchasing power than the same RM10,000 amount today.
Looking at the Real Value of Savings
Inflation is also important when thinking about savings.
Leaving RM10,000 untouched for many years means the numerical balance may still say RM10,000, but what that money can purchase may gradually decline.
The updated calculator makes this easier to illustrate.
Users can enter an amount saved in an earlier year and compare it against a later year to see approximately how much money would be required to preserve equivalent purchasing power.
This helps demonstrate one of the fundamental concepts behind long-term saving and investing: maintaining the value of money often requires returns that at least keep pace with inflation.
The calculator itself does not provide investment advice, but it can help users understand why inflation matters when thinking about long-term financial planning.
Seeing How Everyday Prices Change Over Decades
Another interesting use of the calculator is simply looking back at historical prices.
Many Malaysians remember when certain meals, drinks, petrol prices, movie tickets or everyday services were considerably cheaper.
However, comparing individual prices can sometimes be misleading because specific products can change for many reasons.
Technology becomes cheaper.
Housing can increase faster than general inflation.
Government subsidies can affect certain goods.
Consumer preferences change.
Products themselves may also improve or change substantially.
The CPI provides a broader perspective by looking at the average movement of consumer prices across many categories.
Using the calculator alongside memories of historical prices can therefore provide useful context for understanding how much of a price increase might reflect broader inflation.
Quick Year Selection Makes Comparisons Faster
The redesigned application also introduces quick year selections for several commonly compared periods.
Instead of manually scrolling through a long historical list every time, users can quickly jump to years such as 1970, 1990, 2000, 2010, 2020 and 2026.
This makes it much faster to test different historical scenarios.
A user might start by checking the purchasing power of RM1,000 in 1990, then quickly compare the same amount with 2000 and 2010.
Having this ability encourages users to explore the data rather than performing just a single calculation.
From Year and Target Year Are Now More Flexible
The previous version of the calculator was more focused on comparing historical money against a fixed modern value.
The updated calculator provides greater flexibility by allowing both a From Year and a Target Year.
This means users are no longer restricted to comparisons involving the current year.
For example, users can compare:
RM5,000 in 1985 with 2000.
RM20,000 in 2000 with 2015.
RM100 in 1970 with 1990.
RM10,000 in 2010 with 2026.
This makes the calculator useful for historical research and comparisons even when the user is not interested in today's value.
A swap function also allows users to quickly reverse the selected years.
Clearer Explanations About What Inflation Results Mean
One of the goals of this update was to avoid presenting inflation calculations as absolute truths.
CPI represents average consumer price movements across a basket of goods and services.
Individual households can experience inflation very differently.
For example, someone who spends a large percentage of their income on housing, healthcare or education may feel very different cost pressures from someone whose spending is concentrated in other categories.
Likewise, a person living in Kuala Lumpur may have a different personal cost-of-living experience compared with someone living elsewhere in Malaysia.
The application therefore explains that the calculated amount should be treated as an approximate purchasing-power comparison based on national CPI data.
It is not intended to claim that every individual product or service changed by exactly the same percentage.
This additional context is important because it makes the results more responsible and realistic.
A Better Tool for Students and Researchers
The Malaysian Ringgit Inflation Calculator can also be useful in educational environments.
Students learning about economics can use it to experiment with CPI and purchasing power without manually calculating decades of inflation data.
Researchers looking at historical Malaysian monetary values can use the calculator to quickly place older figures into modern context.
Someone reading that a project cost RM5 million several decades ago could use the calculator to better understand what that amount might represent in today's purchasing power.
Similarly, historical salary figures, product prices, government expenditure and business costs can become easier to interpret when adjusted for inflation.
The calculator should not replace detailed economic analysis, but it provides a convenient starting point.
Improved Mobile Experience
Many Lemon Web applications are accessed through mobile devices, so mobile usability was an important part of this redesign.
The updated interface adjusts automatically for smaller screens, making the amount field, year selection, results and charts easier to use without requiring desktop-sized displays.
Result cards reorganize themselves according to available screen space, while important information remains readable.
This makes the calculator useful when someone wants to quickly check a historical Ringgit value directly from a phone.
Copy and Share the Calculation Summary
Another small but useful enhancement is the ability to copy a calculation summary.
After generating a result, users can copy the important figures and interpretation instead of manually typing the numbers elsewhere.
This can be useful when discussing historical values in documents, assignments, emails or conversations.
It also makes the calculator more practical for users who want to perform several comparisons and keep a record of their results.
Why Inflation Calculators Matter
Inflation can sometimes feel abstract because economic reports typically describe it using percentage changes.
People may hear that inflation increased by 2%, 3% or 4%, but those percentages do not always communicate how meaningful the effect becomes over long periods.
A few percentage points in a single year may not sound dramatic.
However, inflation compounds.
Over ten, twenty or forty years, even relatively moderate annual inflation can significantly change the purchasing power of money.
This is why comparing RM100 today with RM100 several decades ago can produce such different results.
The number printed on the currency may be unchanged, but the amount of goods and services that money can purchase has changed.
The Malaysian Ringgit Inflation Calculator helps make this concept easier to see.
Built Around Malaysian Data
Another key reason for this update was to make the calculator specifically relevant to Malaysia.
Many inflation calculators found online primarily use US Consumer Price Index data or inflation information from other countries.
Those tools are useful for their respective economies but cannot accurately represent Malaysian inflation.
Malaysia has its own economic conditions, subsidies, consumer spending patterns, taxation changes, currency movements and price behaviour.
Using DOSM data gives the application a Malaysian foundation.
For users comparing historical Ringgit values, this is far more appropriate than applying inflation figures from another country.
A Growing Utility Rather Than Just a Calculator
This update represents a broader direction for the application.
Instead of treating the Malaysian Ringgit Inflation Calculator as a single-purpose form with an answer at the bottom, the goal is to make it a useful reference for understanding inflation and purchasing power in Malaysia.
The combination of official DOSM data, detailed result explanations and historical charts gives users more information without making the application unnecessarily complicated.
Someone who simply wants an answer can still enter an amount and receive one immediately.
Someone who wants to understand the calculation more deeply can explore the additional CPI figures, inflation measurements and charts.
That balance between simplicity and useful context was one of the main goals of the redesign.
Final Thoughts
The latest Malaysian Ringgit Inflation Calculator update is one of the biggest improvements made to the application so far. With a completely redesigned interface, support for calculations up to 2026, official DOSM Consumer Price Index data, flexible year-to-year comparisons, richer result explanations and interactive historical charts, the tool now provides much more than a simple inflation conversion.
Whether you are curious about how much an old salary would be worth today, comparing historical prices, studying Malaysia's economic history, evaluating the purchasing power of savings or simply wondering how much RM1,000 from decades ago would represent now, the calculator provides an easy way to explore those questions.
Inflation gradually changes the meaning of money over time, and those changes are often much easier to understand when they are expressed in Ringgit instead of percentages alone. The updated Malaysian Ringgit Inflation Calculator is designed to make that story clearer, more visual and much more relevant to Malaysians.











Comments 0