

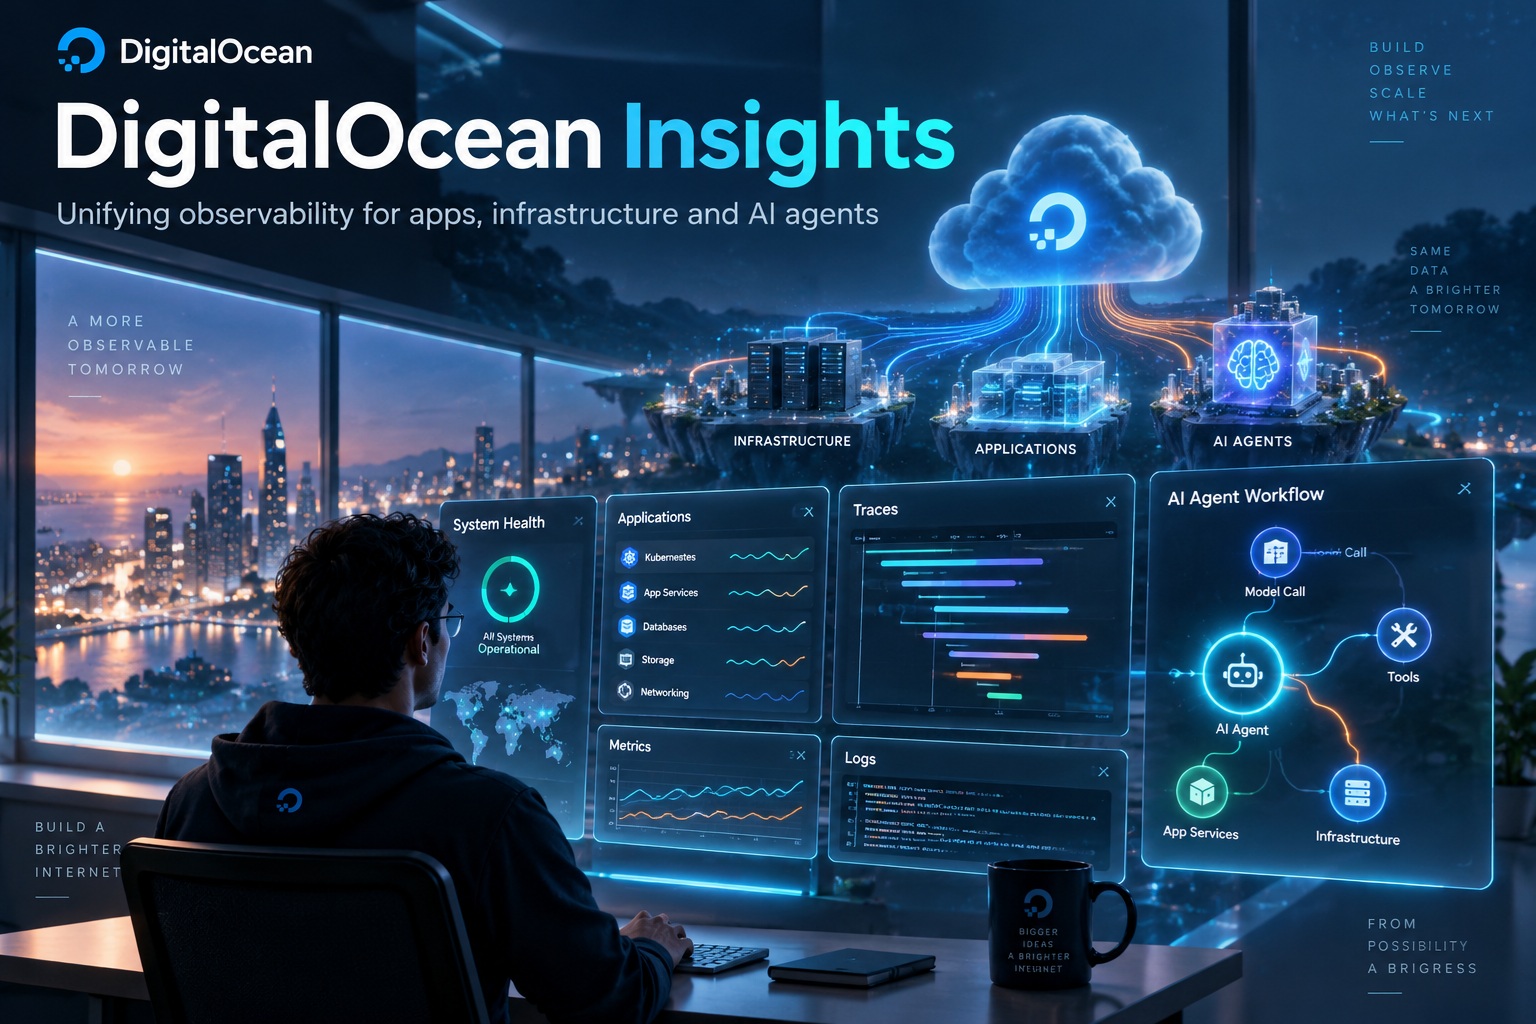
DigitalOcean has introduced the public preview of DigitalOcean Insights, a new observability platform designed to give developers and operators a single place to monitor cloud infrastructure, applications and autonomous AI agents. Rather than forcing teams to stitch together several monitoring products, Insights brings system metrics, structured logs and distributed traces into one control plane across DigitalOcean services.
DigitalOcean Launches Insights To Bring AI Agent And Infrastructure Observability Into One Platform
DigitalOcean has introduced the public preview of DigitalOcean Insights, a new observability platform designed to give developers and operators a single place to monitor cloud infrastructure, applications and autonomous AI agents. Rather than forcing teams to stitch together several monitoring products, Insights brings system metrics, structured logs and distributed traces into one control plane across DigitalOcean services.
The platform forms part of DigitalOcean's Agent Learning Services portfolio and is designed to work directly with services such as DigitalOcean Kubernetes, App Platform and the company's AI infrastructure. One of its biggest selling points is simplicity: DigitalOcean says teams can collect telemetry without having to deploy separate third-party monitoring agents or build their own instrumentation layer first.
Observability Is Becoming More Complicated With AI Agents
Traditional application monitoring was already challenging enough when teams were mainly dealing with servers, containers, APIs and databases. AI agents add another layer because a single user request can move through several stages before returning a result.
An agent may call one model, route the request somewhere else, invoke several tools and depend on multiple pieces of infrastructure underneath. If something becomes slow or fails, developers need to know whether the problem came from the model, the tool, the routing logic or the underlying compute.
DigitalOcean says Insights is designed around that reality. Instead of treating AI agents and infrastructure as separate monitoring problems, the platform tries to connect both sides of the workflow.
OpenTelemetry Is At The Centre Of The Platform
Insights uses OpenTelemetry standards for collecting and storing observability data. This is important because OpenTelemetry has become one of the most widely adopted open standards for metrics, logs and traces across modern cloud environments.
By relying on OpenTelemetry, DigitalOcean avoids locking telemetry into a completely proprietary format. Teams can work with data in a more portable and familiar way, which is useful for organisations already building their observability strategies around OpenTelemetry.
The platform also attaches common context to telemetry generated across DigitalOcean services. This can include project identifiers, resource tags and the cloud resources associated with each event.
That shared context helps teams correlate issues across services without manually building mappings between separate monitoring systems.
Metrics, Logs And Traces Are Brought Together
DigitalOcean Insights collects three main categories of telemetry:
• System metrics
• Structured logs
• Distributed traces
These are presented through explorer-style interfaces that let operators move from a high-level issue down to the specific part of a workload where something went wrong.
For example, a developer could begin with a failed operation, trace it back to its root span and then inspect the particular sub-operation that caused the problem. This is especially useful for distributed applications where one user action can touch several services before completing.
Tracing Agent Workflows Is A Major Focus
The platform becomes particularly interesting when AI agents are involved.
DigitalOcean connects Insights to its serverless inference engines, batch inference systems and inference routing layers. This allows teams to see how model workloads behave alongside the infrastructure supporting them.
The platform can capture telemetry such as:
• Token throughput
• Request latency
• Operational failure rates
• Estimated compute costs
This gives developers a much clearer picture of what is happening inside AI-powered applications rather than treating the model as a black box.
Action Gateway Adds Visibility Into Tool Use
For agentic applications, Insights also integrates with Managed Agents and Action Gateway, which operate through DigitalOcean's Harness Runtime environment.
Action Gateway adds tracing around agent actions, allowing developers to follow a single agent turn from the initial model request through each tool invocation and back again.
That means teams can see exactly where an agent slowed down or failed.
If an agent calls four different tools and one of them adds several seconds of latency, Insights should make that easier to identify. Likewise, if the failure happens during model routing rather than tool execution, developers can see that as part of the same trace.
This Could Be Useful For Debugging Complex AI Apps
One of the hardest problems with agentic systems is figuring out why they behaved the way they did.
A conventional application may follow a fairly predictable execution path. AI agents can be more dynamic, with decisions changing depending on the model output, tool availability or routing logic.
By tying model calls, infrastructure events and tool invocations together, Insights gives teams a chance to see the full journey instead of examining each component separately.
That makes debugging more practical, particularly when an issue only appears under certain production conditions.
PromQL Support Gives More Flexibility
For teams that need more than the default dashboards, Insights supports PromQL queries.
PromQL is widely used for querying time-series monitoring data, particularly in Prometheus-based environments. Supporting it means developers already familiar with Prometheus-style observability should have a relatively familiar way to build custom monitoring views.
DigitalOcean also includes a visual query designer for users who prefer not to write queries manually.
Results can be rendered using several formats including:
• Time-series graphs
• Gauge panels
• Bar charts
• Tables
This makes the platform useful both for quick troubleshooting and more structured operational dashboards.
Common Context Makes Cross-Service Investigation Easier
A major advantage of having telemetry generated directly inside the DigitalOcean platform is consistency.
Because the services already know which project, resource and tags an event belongs to, the telemetry can carry the same contextual information automatically.
That reduces the need for teams to manually connect data from different sources.
For example, an unusual latency spike in an AI agent could potentially be correlated with a specific Kubernetes workload or infrastructure resource without building a custom mapping system between separate monitoring platforms.
That kind of shared context becomes especially important as applications become more distributed.
Alerts Can Be Configured Programmatically
Insights is not limited to passive monitoring.
Teams can define metric-based alerts with configurable evaluation windows, decide how frequently notifications should be repeated and route incidents to external communication channels.
This makes it possible to integrate Insights into an organisation's existing incident-response workflow rather than forcing teams to monitor the DigitalOcean dashboard continuously.
The platform also includes role-based access controls so organisations can control who is allowed to view or modify observability settings.
Telemetry Can Be Managed As Code
DigitalOcean is also exposing observability controls through a public API.
That allows teams to configure telemetry resources programmatically and manage them as code rather than relying entirely on manual dashboard configuration.
For organisations already using infrastructure-as-code practices, this is an important capability. Monitoring configuration can be versioned, reviewed and deployed alongside the rest of the application infrastructure.
It also makes it easier to standardise observability across multiple environments.
Public Preview Is Free For Now
DigitalOcean Insights is currently available as a public preview and does not carry an additional charge during this stage.
However, usage is still subject to specific policies and retention limits defined by the service.
Because the platform remains in preview, DigitalOcean is also not providing production-grade performance guarantees.
That means teams considering it for critical workloads should evaluate whether the current preview behaviour is reliable enough for their requirements before depending on it as their only monitoring platform.
Production Teams Should Treat Preview Status Seriously
Public previews can be useful for testing new services, but they come with trade-offs.
Features may change, limits may be adjusted and service behaviour may not yet be as predictable as a generally available product.
For development and testing environments, that may be perfectly acceptable. For mission-critical production systems, teams should be more cautious.
DigitalOcean itself makes it clear that users need to assess whether the preview's current scale and reliability meet their operational needs.
Existing Monitoring Will Eventually Move Under Insights
DigitalOcean plans to consolidate its existing monitoring capabilities under the Insights branding once the platform reaches general availability.
Current monitoring configurations will continue to work during the transition.
This is useful because organisations already using DigitalOcean's existing monitoring tools will not need to immediately rebuild everything just to try Insights.
Over time, however, Insights appears set to become the central observability layer across the DigitalOcean platform.
Why This Matters For DigitalOcean Users
The introduction of Insights reflects how much observability itself is changing.
Monitoring used to focus mainly on CPU usage, memory consumption, network activity and application logs. Modern AI workloads need visibility into an entirely different set of behaviours, including model calls, tool execution, routing decisions and token consumption.
Bringing all of that together can reduce the number of disconnected monitoring systems teams need to operate.
For DigitalOcean users already running Kubernetes, App Platform and AI workloads on the same cloud, that integrated approach could be particularly attractive.
AI Costs Become Easier To Track
One practical addition is cost visibility around model execution.
AI workloads can become expensive surprisingly quickly, especially when agents make several model or tool calls for a single user request.
By collecting token throughput and estimated compute costs alongside latency and failures, Insights can help developers understand not just whether an agent works, but how efficiently it works.
That information could become valuable when optimising agent workflows or choosing between different models and routing strategies.
Observability Is Becoming Essential For Agentic Software
AI agents are moving beyond experimental prototypes and into production applications.
Once that happens, developers need the same kind of operational visibility they expect from conventional services.
If an agent fails, organisations need to know why. If response times suddenly increase, they need to locate the bottleneck. If costs spike, they need to understand which workflows are responsible.
Insights is DigitalOcean's attempt to bring those requirements into one platform rather than treating AI observability as a separate problem.
Final Thoughts
DigitalOcean Insights represents a significant expansion of the company's monitoring capabilities, especially for developers building AI-powered and agentic applications. By bringing system metrics, structured logs, distributed traces, model telemetry and tool invocation data into one control plane, the platform aims to make complex cloud workloads easier to understand.
The use of OpenTelemetry standards, PromQL support and programmatic configuration should also make it familiar to teams already working with modern observability tooling. The most interesting part, however, is the way DigitalOcean connects AI agent behaviour directly with the infrastructure underneath it.
For now, Insights remains a free public preview without production-grade guarantees, so organisations should evaluate it carefully before relying on it for critical monitoring. But if the platform develops as planned, it could become a useful central observability layer for DigitalOcean customers running everything from Kubernetes applications to increasingly complex autonomous AI agents.










Comments 0