

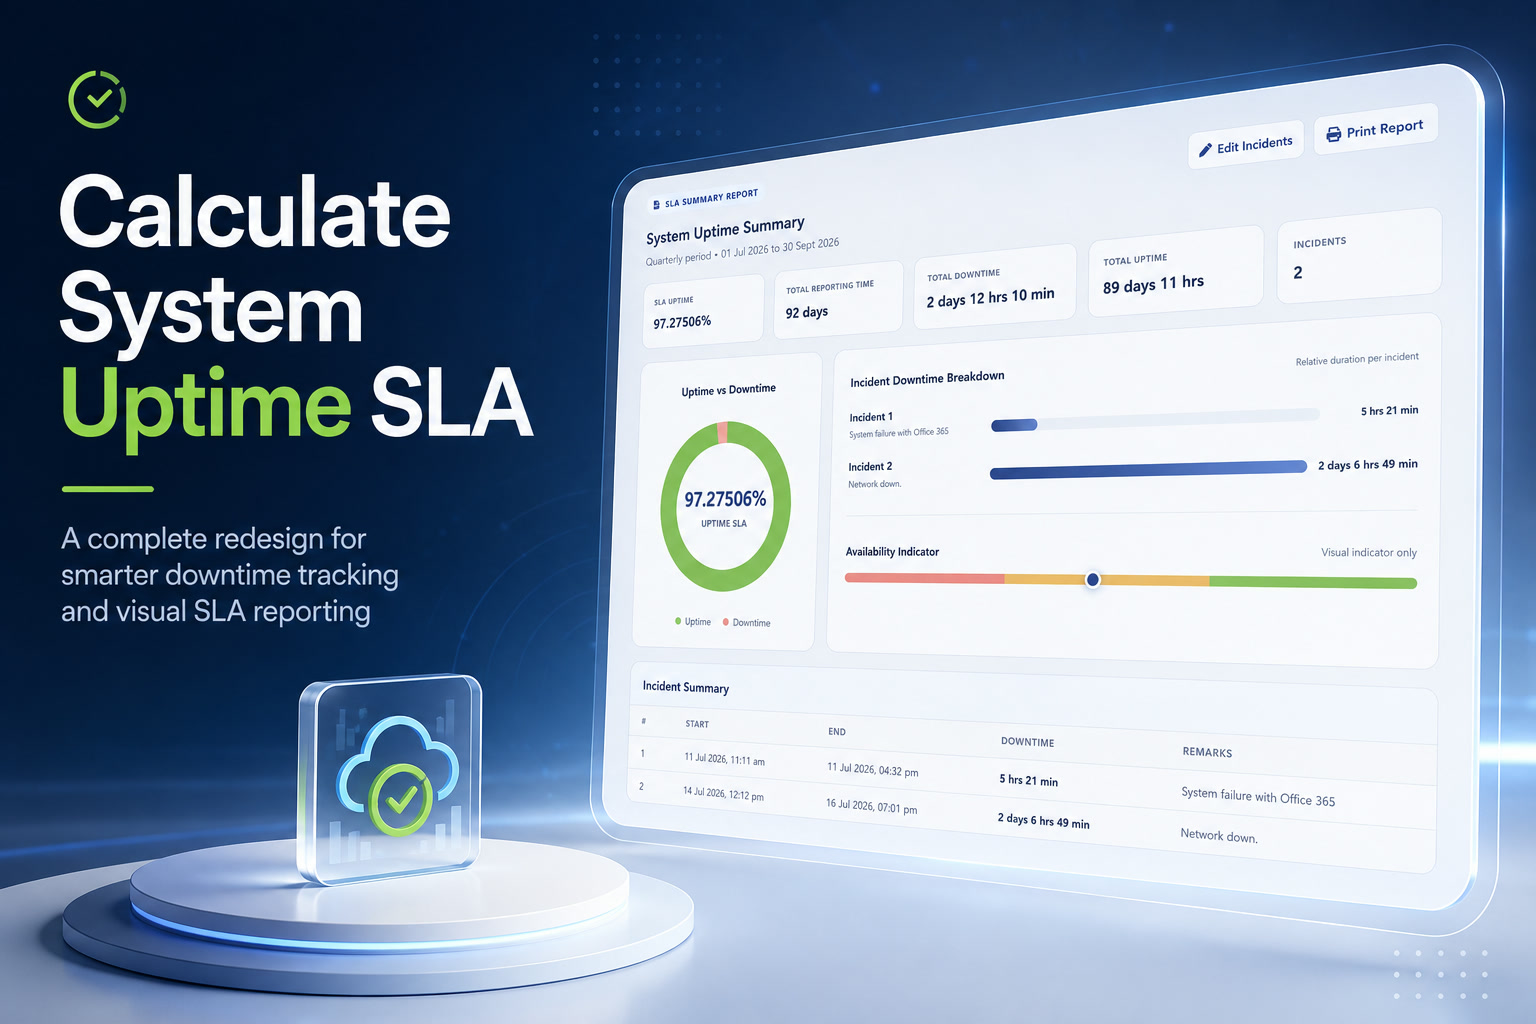
Tracking system availability sounds straightforward until you actually need to prepare a proper SLA report. A few minutes of downtime here, an application outage there, maintenance happening after office hours, and suddenly calculating the actual uptime percentage becomes much more complicated than expected.
That is why I have completely redesigned the Calculate System Uptime SLA application on Lemon Web.
Instead of simply entering a total number of downtime days, hours, and minutes, the application now allows users to record individual downtime incidents, calculate their duration automatically, and generate a much clearer SLA summary report.
The aim is simple: make system uptime calculation easier, more structured, and much more useful for IT operational reporting.
Choose the SLA Reporting Period First
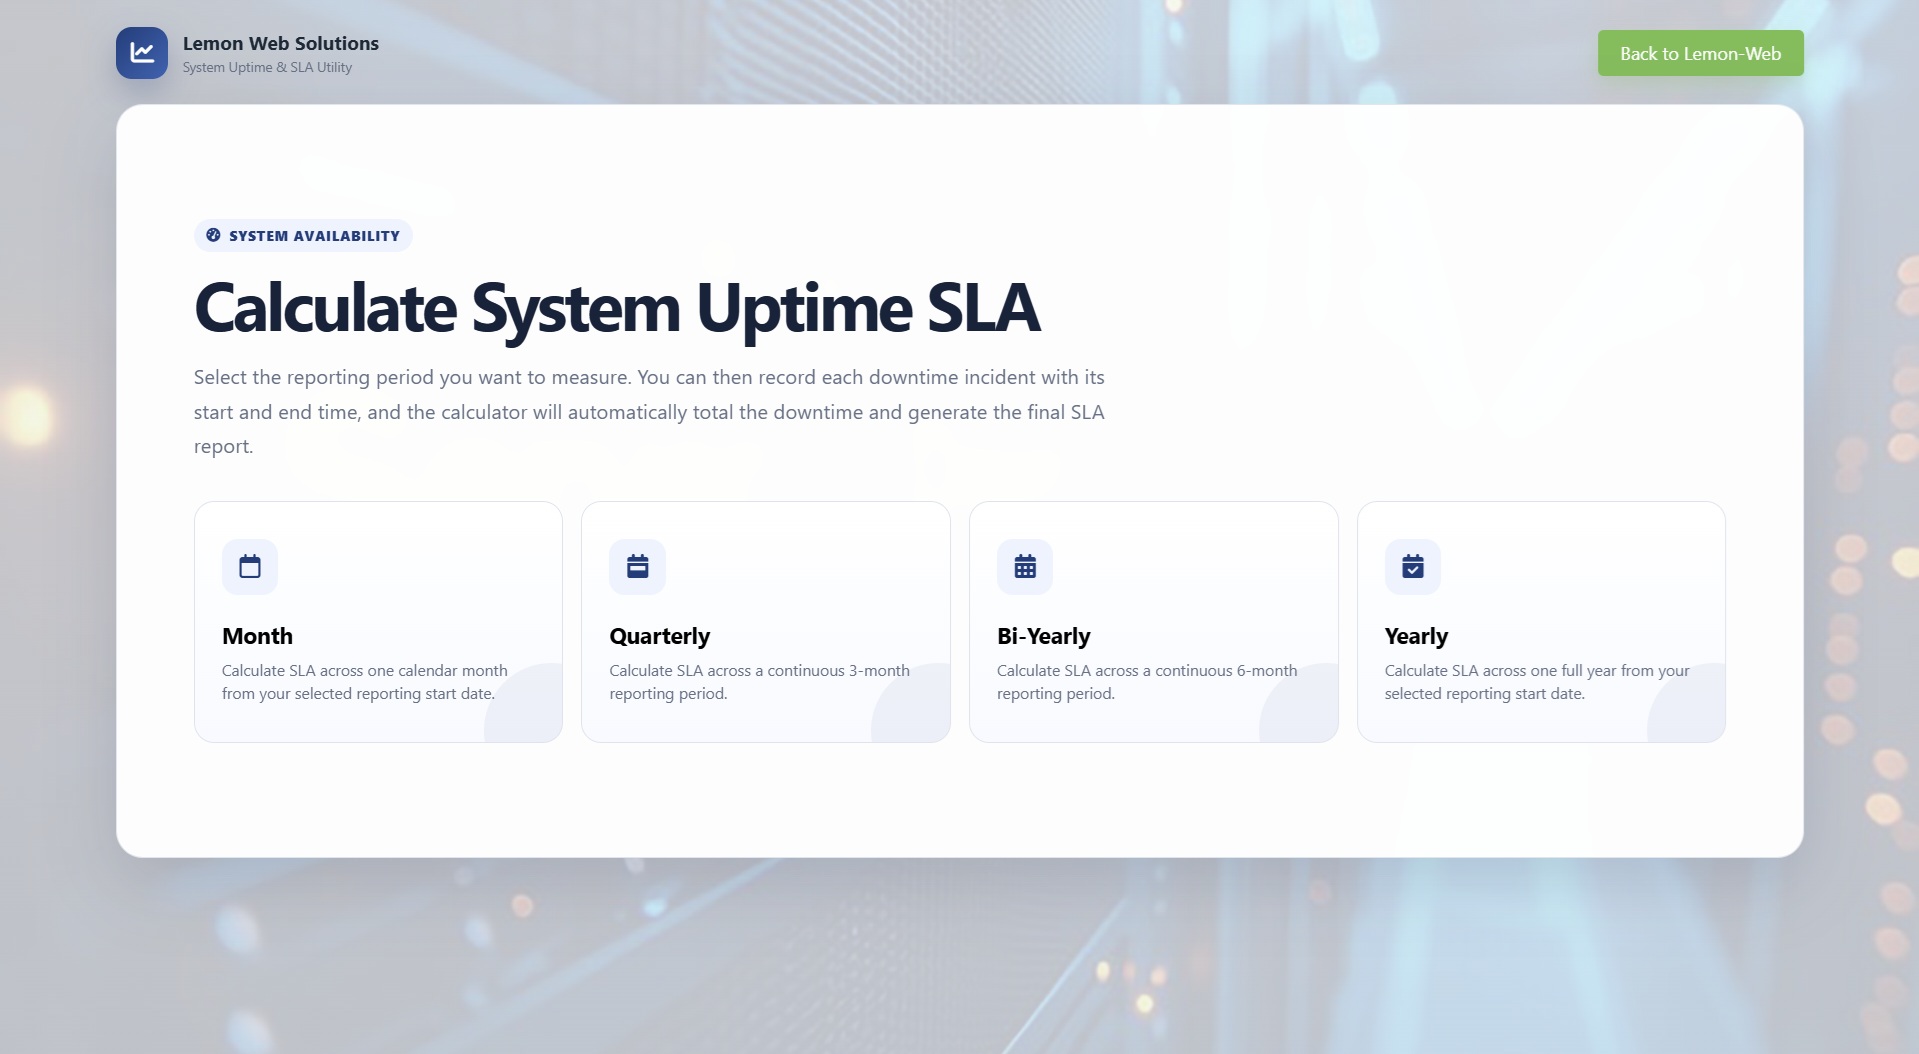
One of the biggest changes is the new reporting-period workflow.
When the application starts, users can now choose whether they want to calculate system uptime for:
This makes the calculator much more flexible than the previous version, which was primarily designed around yearly uptime calculations.
Once a reporting period is selected, the application automatically prepares the appropriate calculation workspace.
Users can also specify the reporting period start date, while the application automatically determines the corresponding end date and total reporting duration.
This is especially useful for organizations that perform regular monthly or quarterly SLA reviews instead of only measuring system uptime annually.
Record Downtime as Individual Incidents
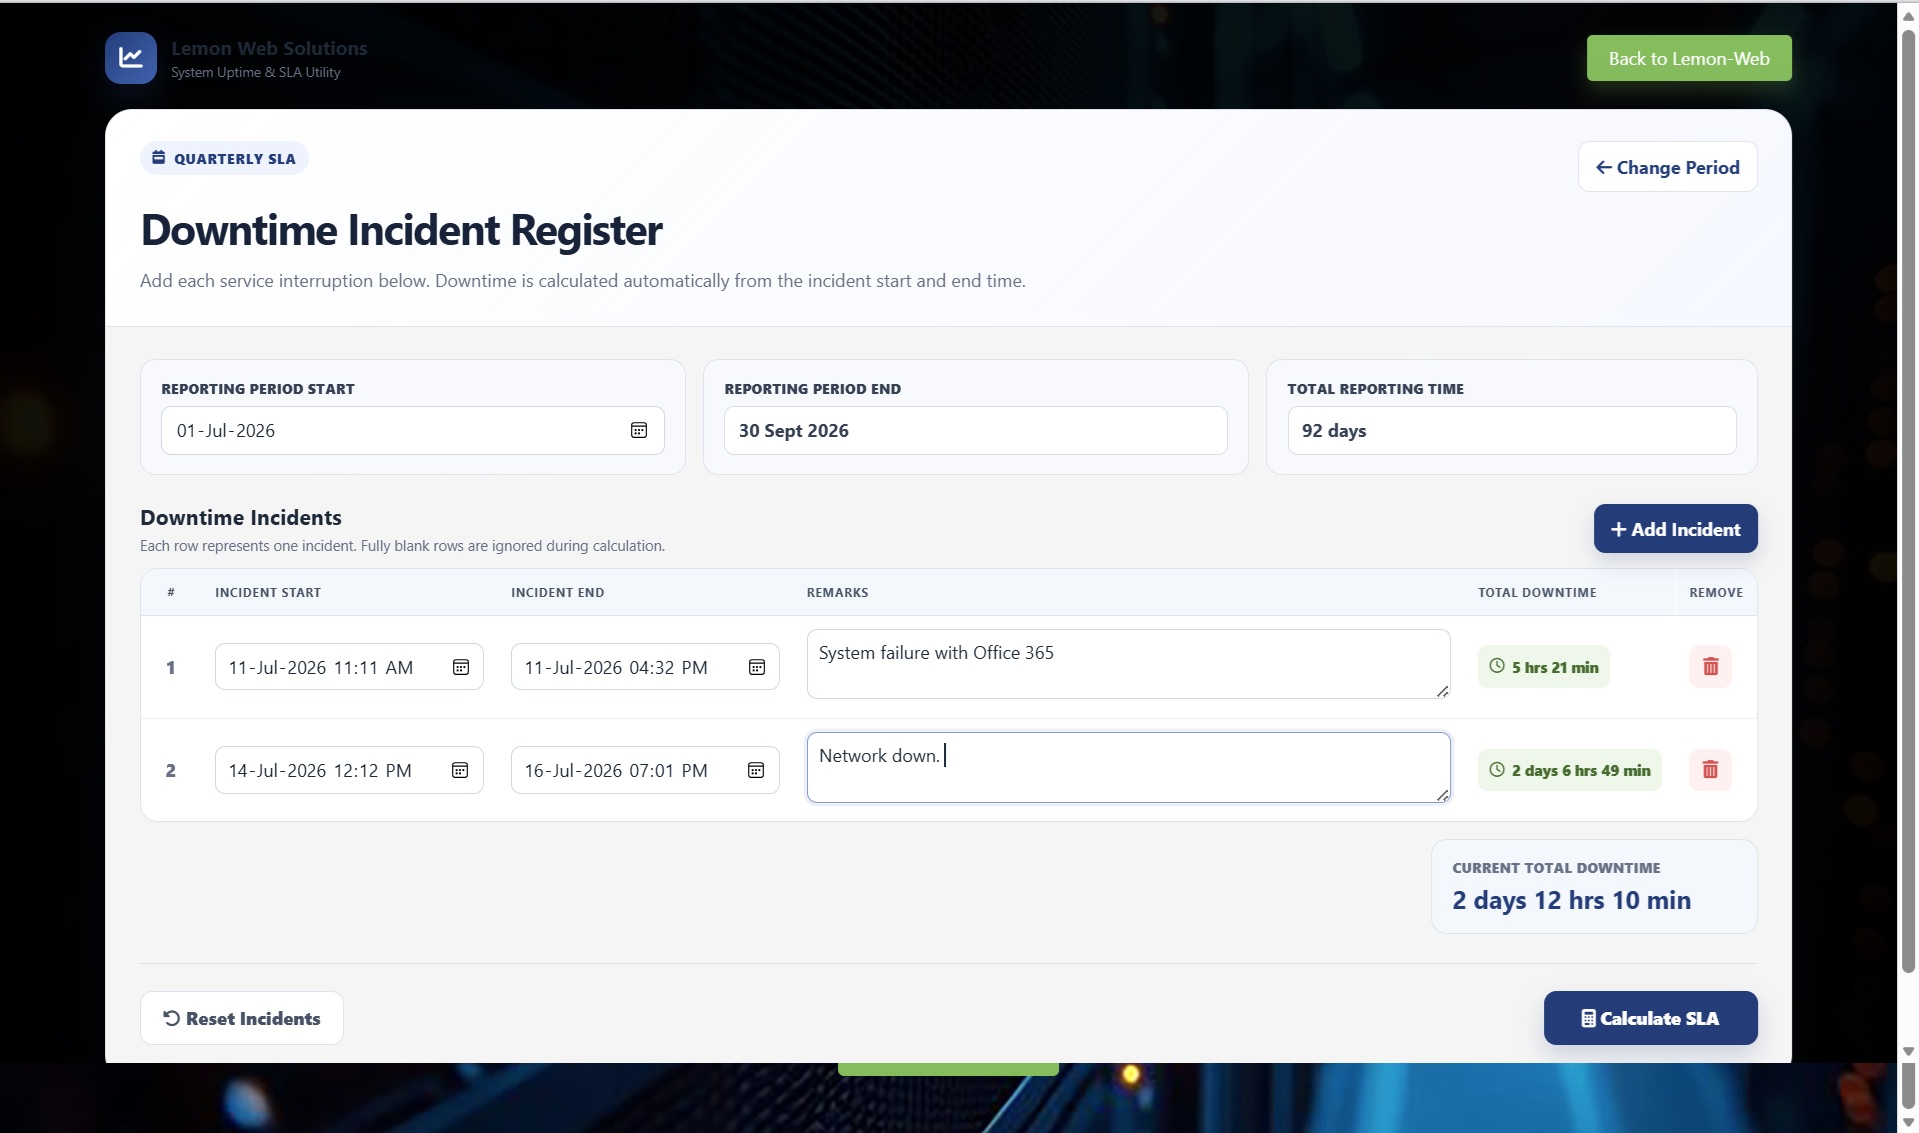
Instead of asking users to manually calculate the total number of downtime minutes beforehand, the redesigned calculator now works using an incident register.
Each row represents one downtime incident.
For every incident, users simply provide:
The application automatically calculates the duration of that incident.
For example, if a system went offline at 10:15 AM and recovered at 11:05 AM, the calculator automatically determines that the incident resulted in 50 minutes of downtime.
There is no longer any need to manually convert everything into hours or minutes before entering it into the calculator.
Add as Many Downtime Incidents as Required
System outages rarely happen only once during an entire reporting period.
Because of this, the new version includes an Add Incident button that allows additional downtime records to be added whenever required.
Each new row behaves independently and automatically calculates its own downtime duration.
If an incident was added accidentally, a Remove button is available directly on the corresponding row.
This makes the calculator suitable for anything from a simple monthly report with one short outage to a yearly SLA review containing many separate incidents.
Live Total Downtime Calculation
Another useful improvement is the new running downtime total.
As users enter incident start and end times, the application continuously updates the Current Total Downtime.
This allows users to immediately see the cumulative impact of all recorded incidents even before generating the final SLA report.
It also makes it easier to identify unusual results while entering the data.
If the downtime suddenly appears much higher than expected, users can review their incident entries before proceeding further.
Smarter Validation Instead of Basic Browser Alerts
The previous version relied on simple browser alerts when invalid values were entered.
The redesigned application now includes proper validation popup modals that explain exactly what needs to be corrected.
For example, the calculator checks for situations such as:
This is particularly important for SLA reporting because even one incorrect incident time could significantly affect the final uptime percentage.
Rather than simply stopping the calculation, the application now clearly explains which incident requires attention and why.
Confirmation Before Calculating the SLA
Once all incident records pass validation, clicking Calculate SLA does not immediately generate the result.
Instead, the application presents a confirmation window summarizing the reporting period, number of incidents, and total downtime recorded.
This gives users one final opportunity to review the information before generating the report.
It is a small addition, but it helps reduce accidental calculations based on incomplete or incorrectly entered data.
A Much Better SLA Summary Report
The most noticeable improvement appears after the calculation is completed.
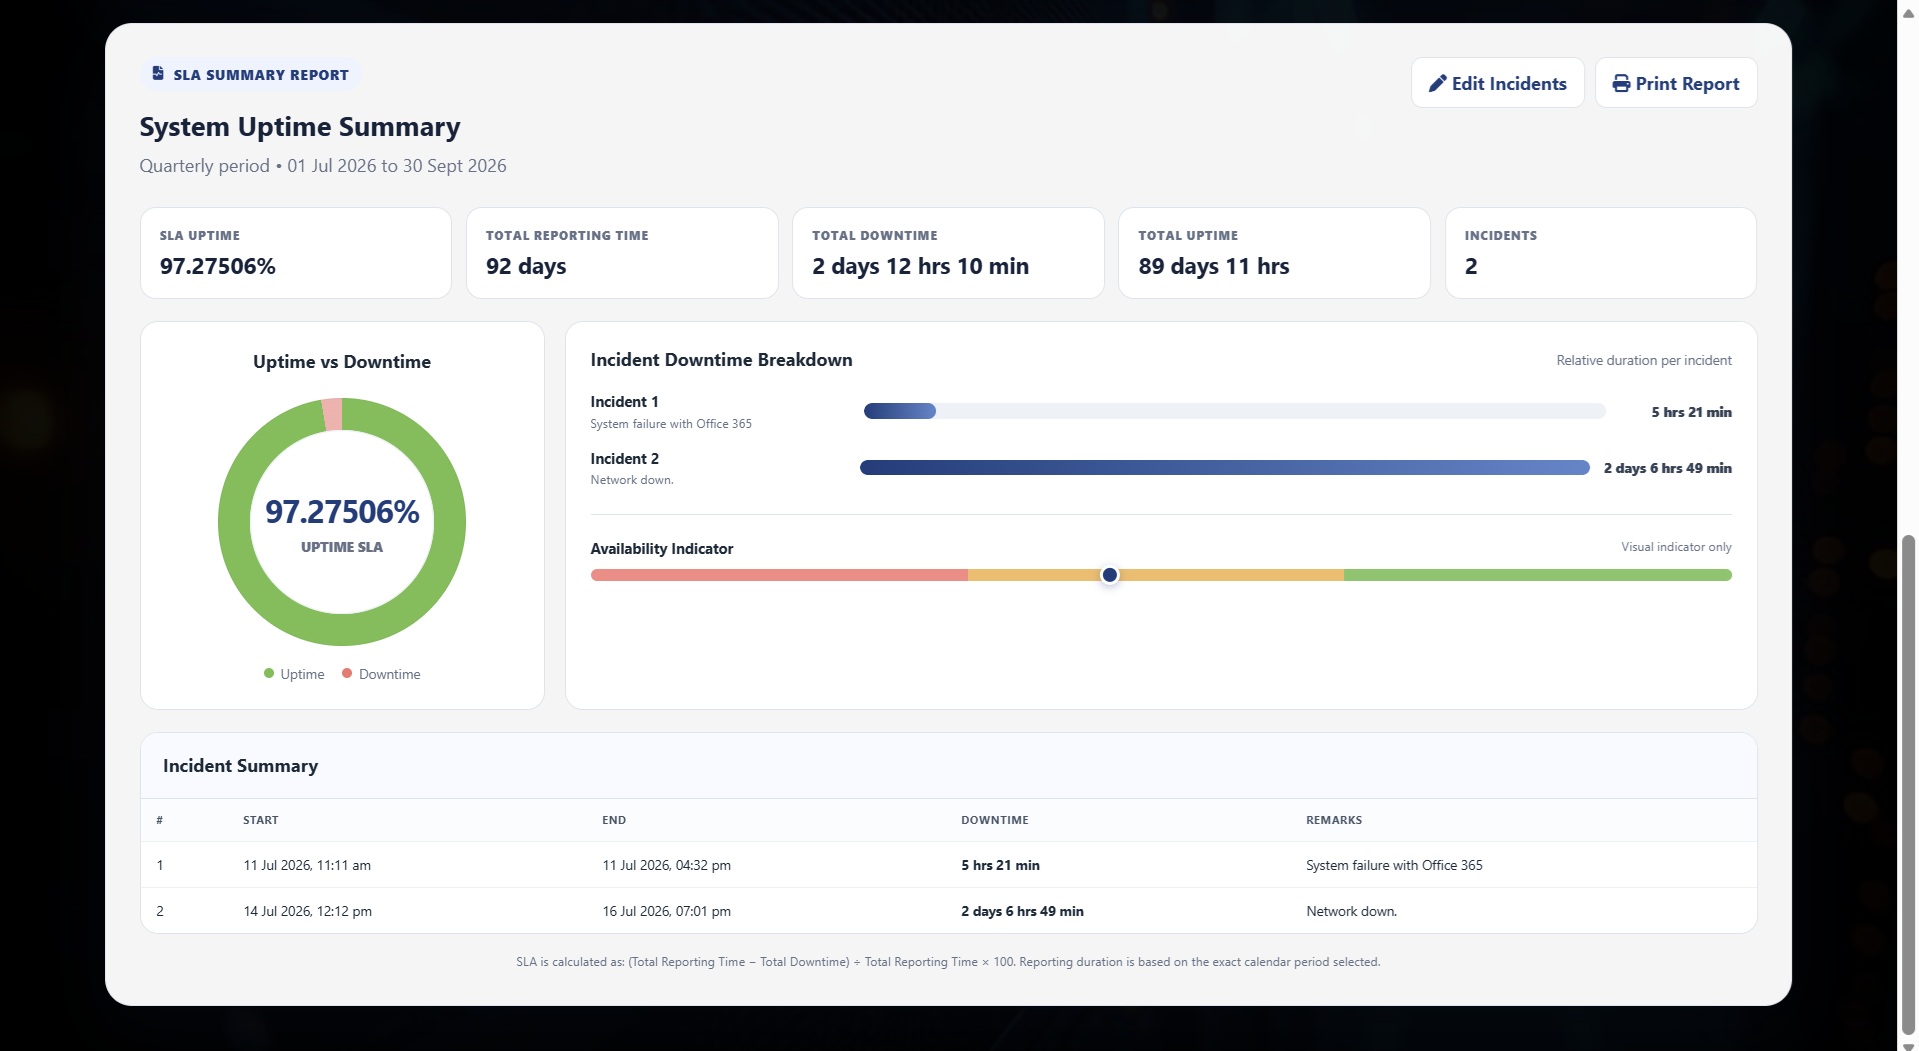
Instead of displaying only a basic uptime percentage, the application now generates a structured System Uptime Summary Report.
The report includes several important measurements:
This provides a much better overview of system availability during the selected period.
The SLA is calculated using the standard availability formula:
The result is displayed with additional decimal precision so even very small downtime incidents can be reflected accurately.
Visual Uptime and Downtime Graph
Numbers are useful, but graphs make the information much easier to understand.
The new summary report therefore includes a visual Uptime vs Downtime chart.
The chart provides an immediate visual representation of how much of the reporting period the system remained available compared with how much time was lost to downtime.
For highly available systems, the downtime section may appear extremely small—which is exactly what you would expect when systems are achieving uptime figures close to 99.9% or higher.
Incident Downtime Breakdown
The report also generates a separate graphical breakdown of individual incidents.
Each incident is represented according to its downtime duration, making it much easier to identify which outage contributed the most to the overall downtime.
This can be particularly useful during monthly IT operational reviews.
Instead of simply reporting that a system achieved a certain SLA percentage, IT teams can immediately identify whether the result was caused by:
This makes the calculator useful not only for calculating SLA but also for understanding the underlying downtime pattern.
Detailed Incident Summary
Every recorded downtime incident is also included in the final report.
The summary shows the incident start time, end time, total downtime, and any remarks entered by the user.
This creates a simple audit trail behind the calculated SLA percentage.
For example, rather than reporting only:
the report can also show exactly which downtime incidents contributed to that final figure.
That makes the result far easier to explain during management meetings, operational reviews, audits, or service-performance discussions.
Print-Friendly Reporting
The redesigned application also includes a Print Report function.
Once the SLA calculation has been generated, users can print the summary directly or use the browser's print function to save it as a PDF.
This makes it convenient for monthly reporting, SLA documentation, IT governance records, or management presentations.
If something needs to be corrected, users can simply return to the incident list, update the relevant record, and calculate the report again.
Designed for Real IT Operational Reporting
The original calculator was useful when you already knew the total downtime and simply wanted to convert it into an uptime percentage.
The new version takes a very different approach.
It is now designed around the way system downtime is actually recorded in day-to-day IT operations.
Instead of asking:
the application allows IT teams to record:
The application then handles the calculations.
That makes the final SLA figure easier to verify, easier to explain, and much easier to reproduce later.
A Cleaner and More Modern Interface
The entire application interface has also been redesigned.
The old compact calculator layout has been replaced with a more spacious and responsive interface designed around a proper workflow:
The application works across desktop and smaller screens, while the original green Back to Lemon-Web button has been retained so users can easily return to the main Lemon Web Applications page.
Final Thoughts
The updated Calculate System Uptime SLA application is no longer just a simple uptime percentage calculator.
It has evolved into a lightweight system availability and downtime reporting tool.
By allowing users to record individual incidents, automatically calculate downtime, validate incorrect entries, detect overlapping outages, calculate exact reporting periods, and generate visual reports, the application provides a much more practical way of monitoring SLA performance.
Whether you are reviewing system availability every month, preparing a quarterly IT report, conducting a six-month service review, or calculating annual uptime, the redesigned calculator should make the entire process significantly easier.
Most importantly, users no longer need to manually calculate downtime before using the application.
Simply record when the system went down and when it came back online, and let the calculator handle the rest.











Comments 0