

Global supply chains have become much more unpredictable over the past few years. From geopolitical tensions and shipping delays to rising fuel prices and commodity fluctuations, many of these issues may seem far away at first, but they can eventually affect everyday life in Malaysia through higher prices, delayed goods, and uncertainty in key sectors.
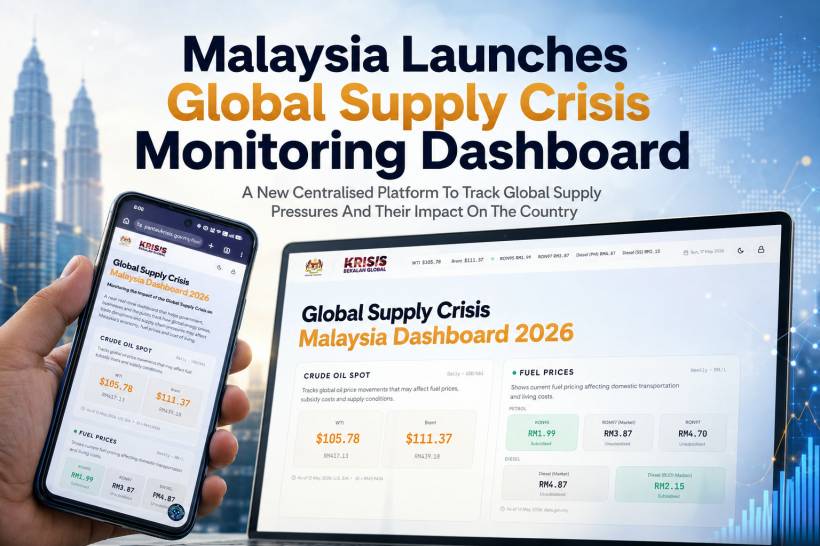
To give the public a clearer view of what is happening, the Malaysian government has launched the Global Supply Crisis Monitoring Dashboard, a new platform designed to track global supply-related pressures and their impact on the country. Instead of leaving the public to piece together information from separate reports, news updates, and market summaries, the dashboard brings key data into one centralised place.
A New Tool For Monitoring Global Supply Pressures
The dashboard was developed by the Ministry of Economy in collaboration with the Department of Statistics Malaysia. According to the ministry, the platform introduces a more data-driven way of monitoring crisis developments by using near real-time information.
This is important because supply chain issues are rarely caused by one single factor. A sudden rise in fuel prices, a disruption in shipping routes, currency movement, or changes in commodity trade can all influence the cost and availability of goods. By placing these indicators in one dashboard, the government is trying to make it easier for users to see how different global developments may be connected.
For the public, this means the dashboard can act as a reference point to understand why certain prices may be rising, why specific industries may be affected, or why the economy is reacting to global events in a certain way.
What The Dashboard Shows
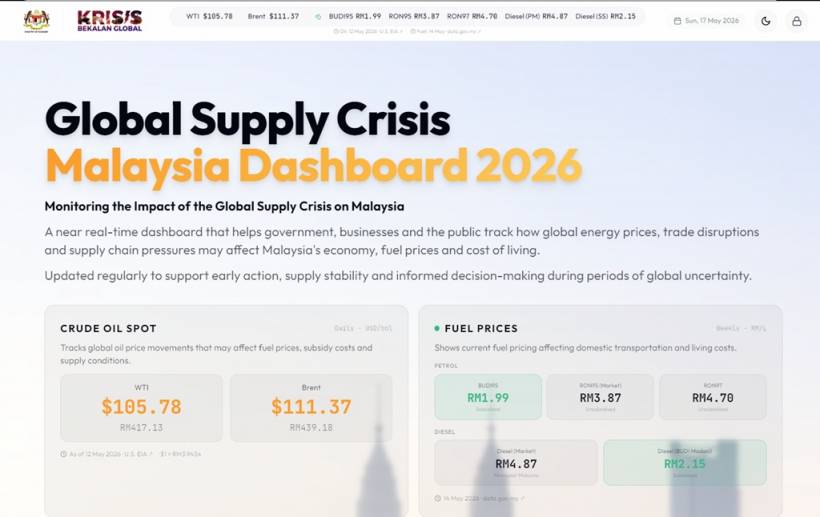
When users open the dashboard, they are presented with an overview of several important indicators, including crude oil spot prices, fuel prices, and petroleum trade summaries. These are among the most closely watched data points because energy prices often influence transport, manufacturing, food distribution, and general business costs.
Beyond that, the dashboard also tracks global energy prices, national economic indicators, currency exchange movements, petroleum trade performance, and commodity trade analytics. These categories give users a broader picture of how global supply challenges may be shaping Malaysia's economy.
Another useful feature is that users can click on the individual tables to view the original data sources. This gives the platform an added layer of transparency, especially for users who want to verify figures or understand where the information is coming from.
Making Complex Data Easier To Understand
One of the more practical additions to the dashboard is the AI assistant. Not everyone is comfortable reading charts, graphs, and economic tables, especially when the subject involves global markets and trade flows. The AI assistant is intended to help summarise the information shown on the platform, making the data more understandable for general users.
This is a good move because dashboards can easily become overwhelming if they only display raw figures. A chart may show that crude oil prices have increased, for example, but users may still want a simpler explanation of what that means and why it matters.
The dashboard also includes a news feed, which helps users connect market movements with real-world events. This is useful because economic data often changes in response to external developments such as conflicts, shipping disruptions, policy changes, or sudden supply shortages.
A More Transparent Platform For The Public
Economy Minister Akmal Nasrullah Mohd Nasir said the dashboard will display information related to energy issues, commodities, cost of living, economic performance, and trade flows. In other words, it is not just a technical platform for economists or policymakers. It is also meant to give ordinary Malaysians a more transparent way to monitor developments that may affect daily expenses and the wider economy.
This kind of public-facing dashboard can be useful during uncertain periods because it allows users to follow key indicators directly, rather than relying only on scattered updates. For businesses, especially those affected by fuel costs, imports, exports, or raw material prices, the platform may also serve as a helpful reference for planning and decision-making.
The dashboard also reflects a broader shift in how governments communicate economic risks. Instead of only responding after a disruption becomes serious, there is now more emphasis on tracking early signals and giving both policymakers and the public better access to information.
Internal Crisis Monitoring Is Also Being Developed
Apart from the public dashboard, the government is also working on a separate internal platform to monitor crisis developments and identify potential risks earlier. This internal system is expected to help agencies prepare mitigation strategies and response measures in a more structured way.
This is especially important because supply chain problems can escalate quickly. A disruption in one region can affect shipping routes, fuel prices, raw material availability, and eventually consumer prices. Having an internal system for early risk detection could help agencies respond faster and coordinate better across different sectors.
The public dashboard focuses on transparency and awareness, while the internal platform appears to be aimed at planning, preparedness, and government response. Together, both tools suggest that Malaysia is trying to move toward a more proactive approach to managing global economic uncertainty.
Why This Matters For Malaysia
For Malaysia, global supply disruption is not just a foreign trade issue. It can affect fuel costs, food prices, construction materials, business operations, and the cost of living. When energy and commodity prices shift, the impact can eventually flow through to consumers and businesses.
This is why a centralised monitoring dashboard can be useful. It gives the public a clearer view of the broader economic environment and helps explain why certain market changes are happening. It also allows users to better understand how international developments may eventually reach the local economy.
At a time when many people are concerned about rising living costs, having better access to economic data can help reduce confusion. It may not solve the problem directly, but it gives the public a better foundation for understanding the situation.
Final Thoughts
The launch of the Global Supply Crisis Monitoring Dashboard is a meaningful step toward more open and data-driven crisis monitoring in Malaysia. By combining energy data, commodity trends, trade indicators, currency movements, economic statistics, news updates, and AI-assisted summaries, the platform gives users a more complete view of the pressures affecting supply chains and living costs.
More importantly, it shows that crisis management is no longer just about reacting after problems appear. With the right tools, governments can monitor risks earlier, communicate more clearly, and prepare more structured responses. For Malaysians, the dashboard offers a useful way to follow global supply developments and better understand how international uncertainty may affect the local economy.


Comments